
The year 2025 was extraordinary for the economy and the markets. Sweeping tariffs, a cooling labor market, rising consumer prices, a prolonged U.S. federal government shutdown, turmoil in the Middle East, and the ongoing Russia/Ukraine war were some of the many factors that should have signaled economic contraction and a downturn in the stock market. Yet, the opposite occurred. Gross domestic product expanded, largely driven by strong consumer spending. Each of the major stock market indexes listed here posted solid year-end gains. Corporate profits and earnings grew, despite the unemployment rate increasing to its highest level since September 2021. Throughout the year, there were several major events that impacted the stock market and the economy.
The year began rather benignly until April, when President Trump rolled out a fresh round of tariffs across a wide range of imported goods. Unsuspecting investors were shaken, worried about a possible recession and rising inflation. The immediate response was a major move away from equities, causing a spike in volatility. In addition to a plunge in stock prices, the value of the U.S. dollar fell, while U.S. government Treasuries, normally viewed as a safe haven, also saw a selloff, pulling bond prices lower, while pushing yields higher. Over the course of the next several months, new trade agreements prompted a reduction in some tariff rates on certain imports, helping to calm investors' concerns. Nevertheless, despite geopolitical headwinds and valuation concerns, equities delivered a robust year, largely fueled by the continued artificial intelligence boom and a resilient consumer.
The "Department of Government Efficiency" (DOGE), led by Elon Musk, implemented aggressive spending cuts and federal workforce reductions. While proponents cited long-term savings, the immediate impact included disruptions to government services and a government shutdown in October.
Consumer prices remained stubbornly elevated for much of the year. Inflation, as measured by the Consumer Price Index (CPI), stayed "sticky," hovering around 3.0%-3.1%, well above the Fed's 2.0% target. This persistence was attributed partly to new universal import tariffs and trade disputes that raised costs for goods. In 2025, prices for food rose 2.6%, while shelter prices rose 3.0%. Prices at the wholesale level rose 2.7% for the year, which included a 4.0% rise in prices for food and a 3.8% jump in energy prices.
The economy grew in 2025, despite early-year volatility and aggressive trade policy shifts. Gross domestic product expanded by approximately 1.8% to 2.0% for the full year. Growth was uneven; after a sluggish start in the first quarter, activity accelerated significantly in the third quarter, reaching a robust 4.3% annualized rate of growth before moderating again in quarter four. Consumer spending remained the primary engine of economic growth but became increasingly reliant on higher-income households. Business investment, particularly in artificial intelligence (AI) and software, provided a critical tailwind, offsetting weakness in manufacturing and housing. According to FactSet, S&P 500 companies were projected to report earnings growth of approximately 12.1%-12.3% for 2025. This performance is well above the 10-year average of 8.6%.
Corporate revenues for the year grew by approximately 6.9% to 7.0%, also surpassing the 10-year average of roughly 5.3%. The estimated net profit margin, at 12.9%-13.0%, would mark the highest annual net profit margin since FactSet began tracking the metric in 2008. The housing sector remained relatively cool for much of the year. While mortgage rates began to recede January 05, 2026 Page 1 of 6, see disclaimer on final page Key Dates/Data Releases 1/2: S&P Global Manufacturing Index 1/6: S&P Global Services Index 1/8: International trade in goods and services 1/9: Employment situation 1/13: Consumer Price Index, Treasury budget 1/14: Existing home sales 1/15: Retail sales, import and export prices 1/16: Industrial production 1/21: Housing starts 1/27: New home sales 1/28: Durable goods orders, international trade in goods, FOMC meeting statement 1/29: GDP, Personal Income and Outlays 1/30: Producer Price Index late in the year due to Fed interest rate cuts, high prices and low inventory kept sale volumes low.
Mortgage rates eased in the second half of the year after peaking at just over 7.0% in January, falling to a low of about 6.12% in October before settling at about 6.15% at the end of the year. A distinct shift in 2025 was the softening of the labor market.
The unemployment rate ticked up steadily throughout the year, starting near 4.1% and ending at approximately 4.6% in November, the highest level in four years. The rate of new hires decelerated throughout much of the year. While layoffs remained relatively low historically, the "hiring rate" plummeted. Companies became hesitant to backfill roles due to policy uncertainty and AI integration, making it harder for new entrants and the unemployed to find work. Wage gains moderated to roughly 3.5%, in line with long-term averages but lagging somewhat behind the perceived cost of living for many workers.
Overall industrial production ended the year with a gain of about 2.5%. Mining and utilities bounced up and down throughout the year, while manufacturing fought to keep from contracting, influenced by renewed trade tariffs, policy uncertainty, and the protracted government shutdown.
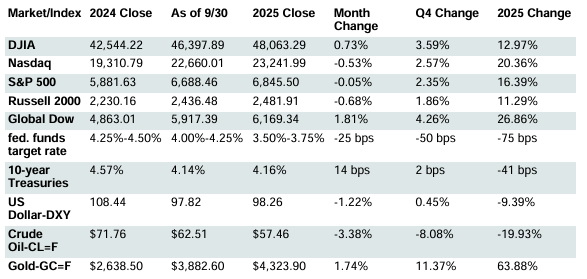
Chart reflects price changes, not total return. Because it does not include dividends or splits, it should not be used to benchmark performance of specific investments.
Snapshot 2025 The Markets
• Equities: Despite early-year volatility driven by trade policy uncertainties, 2025 proved to be a strong year for U.S. equities, with the major indexes (the Dow, the S&P 500, and the NASDAQ) delivering solid annual returns. The market's resilience was supported by solid corporate profitability, a pivot in Federal Reserve monetary policy, and a stabilization of trade relations after a rocky second quarter. Among the major U.S. market indexes, the NASDAQ outperformed, driven by continued strength in AI and tech giants. The S&P 500 notched its eighth straight monthly gain in December, largely influenced by corporate profit growth.
The Dow recovered from a deep dive in April to end the year on an upward trend. U.S. small caps, as measured by the Russell 2000, had a decent but choppy year. While a nearly 11.0% annual return was historically solid, it lagged behind the three major U.S. indexes. On the other hand, 2025 was a banner year for global blue chips. After years of U.S. tech dominance, non-U.S. markets (particularly in Europe and parts of Asia) rallied. The Global Dow, which tracks 150 leading companies from around the world, significantly outperformed the major U.S. market indexes. The Global Dow saw consistent growth through Q2 and Q3, accelerating in Q4 to finish 2025 near record highs.
• Bonds: After years of historic volatility, 2025 offered fixed income investors a "solid" year. While bonds did not match the double-digit rallies seen in equities, they fulfilled their traditional role of providing income and stability, with most core indices finishing firmly in the green. The 2025 U.S. Treasury bond market, however, was defined by significant volatility influenced by new economic legislation, persistent inflation, a shift in fiscal policy expectations, and the conclusion of the Federal Reserve's restrictive interest rate cycle. The 10-year Treasury yield, which began the year at 4.57%, ended the year around 4.16%. Meanwhile, the two-year yield fell more aggressively to approximately 3.46%, reflecting the Fed's rate cuts.
• Oil: In 2025, the crude oil market was defined by a steady downward trend, ending the year at some of Page 2 of 6, see disclaimer on final page its lowest levels since the COVID-19 pandemic. Despite temporary surges driven by geopolitical tensions in Ukraine and the Middle East, a combination of record-breaking U.S. crude production and cooling global demand, particularly from China, led to a cumulative price decline of approximately 20.0% over the year. • Prices at the pump trended higher for the first half of the year, only to decline throughout the remainder of the year. Prices largely responded to changes in global economics, supply and demand, and other extraordinary factors attributable to the unrest in the Middle East. The average retail price for a gallon of regular gasoline was $3.047 at the beginning of the year. By the end of June, the price had risen to $3.213 per gallon, then steadily declined for the remainder of the year, closing with an average price of $2.811 on December 29.
• FOMC/interest rates: The Federal Open Market Committee (FOMC) navigated a complex year defined by "stubborn" inflation, a cooling labor market, and significant geopolitical shifts, including the impact of new trade tariffs. After a period of holding rates steady in the first half of the year, the Fed shifted to a series of 25-basis-point rate cuts starting in September through December, which brought the federal funds target rate range down 75 basis points to 3.50%-3.75%. This brought borrowing costs to their lowest level since 2022. The FOMC is entering 2026 with a cautious stance. Their updated projections suggest only one additional 25-basis-point rate cut for the entirety of 2026.
• US Dollar-DXY: The U.S. dollar experienced its most challenging year in decades, ending a long period of dominance with a significant annual decline. After starting the year at historic highs, the U.S. Dollar Index (DXY) fell by more than 9.0% over the course of the year, marking its steepest drop since 2017. The dollar's downturn was driven by a combination of fiscal, political, and technical factors, including broad-based tariffs and fiscal concerns that led to the downgrading of the U.S. long-term sovereign credit rating.
• Gold: Gold enjoyed a record-breaking year, characterized by an unprecedented rally that saw the precious metal surge nearly 70.0%, its strongest annual gain in over 40 years. Prices rose from roughly $2,600 at the start of the year to an all-time high of over $4,500 per ounce before settling at around $4,324.00.
Last Month's Economic News The following section contains a review of the latest economic data available as of December 31, 2025.
• Employment: Job growth was little changed in November, with the addition of 64,000 new jobs and has shown little change since April. Employment in August was revised down by 22,000, from -4,000 to-26,000, and the change for September was revised down by 11,000, from +119,000 to +108,000. With these revisions, employment in August and September combined was 33,000 lower than previously reported. The unemployment rate was 4.6% in November, 0.2 percentage point higher than the September rate and 0.4 percentage point above the November 2024 estimate. The number of unemployed persons in November, at 7.8 million, edged up 228,000 from September and 710,000 from November 2024. The number of long-term unemployed (those jobless for 27 weeks or more) changed minimally at 1.9 million from September and accounted for 24.3% of all unemployed persons. The total number of long-term unemployed was 256,000 above the estimate from a year earlier. The labor force participation rate inched up 0.1 percentage point to 62.5% in November from September and was unchanged from last November. The employment-population ratio in November, at 59.6%, increased 0.1 percentage point from September and 0.2 percentage point from November 2024 (59.8%). In November, average hourly earnings increased by $0.05 to $36.86. Over the past 12 months ended in November, average hourly earnings rose by 3.5%. The average workweek increased by 0.1 hour to 34.3 hours in November, the same as in November 2024.
• There were 199,000 initial claims for unemployment insurance for the week ended December 27, 2025. During the same period, the total number of workers receiving unemployment insurance was 1,866,000. The insured unemployment rate was 1.2%, the same rate as a year earlier. There were 209,000 initial claims a year ago, while the total number of workers receiving unemployment insurance was 1,828,000.
• FOMC/interest rates: As expected, the Federal Open Market Committee reduced the target range for the federal funds rate by 25.0 basis points to the current 3.50%-3.75% following its meeting in December. In arriving at its decision, the Committee noted that economic activity continued to expand at a moderate pace, job gains have slowed, the unemployment rate increased, while inflation moved up since earlier in the year and remained somewhat elevated. As to future policy actions, the FOMC stated that "In assessing the appropriate stance of monetary policy, the Committee will continue to monitor the implications of incoming information for the economic outlook. The Committee would be prepared to adjust the stance of monetary policy as appropriate if risks emerge that could impede the attainment of the Committee's goals." As to projections for future rate adjustments, the FOMC estimates very gradual declines in the fed funds target rate range over the next few years. Page 3 of 6, see disclaimer on final page
• GDP/budget: The economy, as measured by gross domestic product, accelerated at an annualized rate of 4.3% in the third quarter, following an increase of 3.8% in the second quarter. A year ago, GDP expanded at an annualized rate of 3.3% in the third quarter. Consumer spending, as measured by the personal consumption expenditures index, rose 3.5% in the third quarter, higher than in the second quarter (2.5%) but below the 2024 pace of 3.9%. Spending on services rose 3.7% in the third quarter, compared with a 2.6% increase in the second quarter. Consumer spending on goods increased 3.1% in the third quarter (2.2% in the second quarter). Fixed investment advanced 1.0% in the third quarter (4.4% in the second quarter). Nonresidential (business) fixed investment rose 2.8% in the third quarter compared to a 7.3% increase in the second quarter. Residential fixed investment declined 5.1% in the third quarter, unchanged from the second quarter. Exports rose 8.8% in the third quarter, compared with a 1.8% decrease in the previous quarter. Imports, which are a negative in the calculation of GDP, declined 4.7% in the third quarter after falling 29.3% in the second quarter. Consumer prices increased 2.8% in the third quarter (2.1% in the second quarter). Excluding food and energy, consumer prices advanced 2.9% in the third quarter (2.6% in the second quarter).
• November 2025 saw the federal budget deficit come in at $173 billion, roughly $194 billion less than the deficit of $367 billion from a year earlier. The deficit for the first two months of fiscal year 2026, at $458 billion, is $166 billion lower than the first two months of the previous fiscal year. For fiscal year 2025, which ended September 2025, the government deficit was $1,775 billion, which was $42 billion below the government deficit for fiscal year 2024 ($1,817 billion). For fiscal year 2025, government outlays increased $275 billion, while government receipts increased $317 billion. Compared to the previous fiscal year, individual income tax receipts rose by roughly $250 billion in fiscal year 2025, and corporate income tax receipts decreased by $78 billion.
• Inflation/consumer spending: According to the latest Personal Income and Outlays report, personal income rose 0.4% in September and disposable (after-tax) personal income advanced 0.3%. Consumer spending increased 0.3% in September, unchanged from the previous month. In September, the Personal Consumption Expenditures (PCE) price index rose 0.3% after increasing 0.2% in August. Core prices advanced 0.2% in September, unchanged from the August estimate. The PCE price index rose 3.0% since September 2024, while core prices also rose 3.0% over the same period.
• The Consumer Price Index rose 0.2% in November over the two months from September 2025 to November 2025. Over the 12 months ended in November, the CPI rose 2.7% after rising 3.0% over the 12 months ended in September. Core prices rose 0.2% in November and 2.6% since November 2024. Prices less food and energy rose 2.6% over the last 12 months. Energy prices increased 4.2% for the 12 months ended in November. Prices for food increased 2.6% over the last year. The Bureau of Labor Statistics did not collect survey data for October 2025 due to a lapse in appropriations.
• The latest data reveals that the Producer Price Index increased 0.3% in September after declining 0.1% in August. Producer prices increased 2.7% for the 12 months ended in September, the same 12-month increase for the period ended in August. Excluding food and energy, producer prices ticked up 0.1% in September and 2.6% for the year. In September, prices for goods increased 0.9% from the previous month and 3.3% since September 2024. Last month, prices for services were unchanged but rose 2.5% for the 12 months ended in September.
• Housing: Sales of existing homes increased 0.5% in November but were down 1.0% from November 2024. The median existing home price was $409,200 in November, lower than the October price of $414,900 but 1.2% higher than the November 2024 price of $404,400. Unsold inventory of existing homes represented a 4.2-month supply at the current sales pace, down from October (4.4 months) but above the 3.8-month supply in November 2024. Sales of existing single-family homes increased 0.8% in November. Over the 12 months ended in November, sales of existing single-family homes declined 0.8%. The median existing single-family home price was $413,300 in November, down from $420,200 in October but 1.2% above the November 2024 price of $409,200.
• Sales of new single-family homes jumped higher in August, exceeding expectations, although the inventory of available new homes for sale plunged lower from the previous month. Sales of new single-family homes rose 20.5% in August and were 15.4% above the August 2024 figure. The median sales price of new single-family houses sold in August was $413,500 ($395,100 in July), which was higher than the August 2024 estimate of $405,800. The August average sales price was $534,100 ($478,200 in July), up from the August 2024 average sales price of $475,600. Inventory of new single-family homes for sale in August represented a supply of 7.4 months at the current sales pace, 17.8% below the July estimate of 9.0 months and 9.8% below the August 2024 estimate of 8.2 months.
• Manufacturing: Industrial production (IP) rose 0.2% in November after ticking down 0.1% in October. On average, IP rose 0.1% per month across October and November, the same as the rate of increase in September but a somewhat slower average pace than the past 12 months. Manufacturing output was flat in November after dropping 0.4% in October. There were swings in both mining and utilities output over October and November, though, on net, both sectors posted gains. Mining dipped 0.8% in October Page 4 of 6, see disclaimer on final page but rose 1.7% in November. Utilities fell 0.4% in November after climbing 2.6% in October. IP in November was 2.5% above its year-earlier level.
• New orders for durable goods in October, down following two consecutive monthly increases, fell 2.2%. This followed a 0.7% September increase. Excluding transportation, new orders increased 0.2%. Excluding defense, new orders decreased 1.5%. Transportation equipment, down 6.5%, drove the October decline following two consecutive monthly increases.
• Imports and exports: Import prices were unchanged in September after ticking up 0.1% in August. Higher prices for nonfuel imports (+0.2%) offset lower prices for fuel imports (-1.5%) in September. Prices for U.S. imports rose 0.3% from September 2024 to September 2025. The September increase was the first 12-month advance since the prices rose 0.8% for the year ended March 2025. Prices for U.S. exports were unchanged in September after rising 0.1% the previous month. U.S. export prices increased 3.8% over the 12-month period ended in September, the largest such advance since the prices rose 4.6% for the year ended December 2022.
• The international trade in goods deficit for August was $85.5 billion, 16.8% under the July estimate. Exports of goods for August dipped 1.3%, while imports of goods declined 7.0%. Over the 12 months ended in August, exports decreased 0.4% and imports fell 4.1%.
• The latest information on international trade in goods and services, released December 11, was for September and revealed that the goods and services trade deficit was $52.8 billion, a decrease of $6.4 billion, or 10.9%, from the August deficit. September exports were $289.3 billion, $8.4 billion, or 3.0% more than August exports. September imports were $342.1 billion, $1.9 billion, or 0.6% above the August estimate. Year to date, the goods and services deficit increased $112.6 billion, or 17.2%, from the same period in 2024. Exports increased $125.1 billion, or 5.2%. Imports increased $237.7 billion, or 7.7%.
• International markets: In December 2025, European and Asian stock markets both capped off a strong year with record-breaking performances, though the month began with cautious trading and a brief correction. By the end of the year, the rally was revitalized by a U.S. Federal Reserve interest rate cut and continued optimism surrounding artificial intelligence. For 2025, the STOXX Europe 600 Index rose 19.0%; the United Kingdom's FTSE advanced 20.53%; Japan's Nikkei 225 Index gained 26.18%; and China's Shanghai Composite Index increased 18.41%.
• Consumer confidence: December saw consumer confidence wane, ending the year on a down note. The Conference Board Consumer Confidence Index® decreased in December to 89.1 from 92.9 in November. The Present Situation Index, based on consumers' assessment of current business and labor market conditions, fell 9.5 points to 116.8 in December. The Expectations Index, based on consumers' short-term outlook for income, business, and labor market conditions, held steady at 70.7 in December but has tracked under 80.0 for 11 consecutive months, running below the threshold of 80.0 that usually signals a recession ahead. Eye on the Year Ahead Looking toward to 2026, persistent inflation and a cooling labor market remain key concerns. Potential tax cuts and investment in AI could offer a balance against higher tariffs, rising prices, and a stagnant labor market.
Data sources: Economic: Based on data from U.S. Bureau of Labor Statistics (unemployment, inflation); U.S. Department of Commerce (GDP, corporate profits, retail sales, housing); S&P/Case-Shiller 20-City Composite Index (home prices); Institute for Supply Management (manufacturing/services). Performance: Based on data reported in WSJ Market Data Center (indexes); U.S. Treasury (Treasury yields); U.S. Energy Information Administration/Bloomberg.com Market Data (oil spot price, WTI, Cushing, OK); www.goldprice.org (spot gold/silver); Oanda/FX Street (currency exchange rates). News items are based on reports from multiple commonly available international news sources (i.e., wire services) and are independently verified when necessary with secondary sources such as government agencies, corporate press releases, or trade organizations. All information is based on sources deemed reliable, but no warranty or guarantee is made as to its accuracy or completeness. Neither the information nor any opinion expressed herein constitutes a solicitation for the purchase or sale of any securities, and should not be relied on as financial advice. Forecasts are based on current conditions, subject to change, and may not come to pass. U.S. Treasury securities are guaranteed by the federal government as to the timely payment of principal and interest. The principal value of Treasury securities and other bonds fluctuates with market conditions. Bonds are subject to inflation, interest-rate, and credit risks. As interest rates rise, bond prices typically fall. A bond sold or redeemed prior to maturity may be subject to loss. Past performance is no guarantee of future results. All investing involves risk, including the potential loss of principal, and there can be no guarantee that any investing strategy will be successful. The Dow Jones Industrial Average (DJIA) is a price-weighted index composed of 30 widely traded Page 5 of 6, see disclaimer on final page blue-chip U.S. common stocks. The S&P 500 is a market-cap weighted index composed of the common stocks of 500 largest, publicly traded companies in leading industries of the U.S. economy. The NASDAQ Composite Index is a market-value weighted index of all common stocks listed on the NASDAQ stock exchange. The Russell 2000 is a market-cap weighted index composed of 2,000 U.S. small-cap common stocks. The Global Dow is an equally weighted index of 150 widely traded blue-chip common stocks worldwide. The U.S. Dollar Index is a geometrically weighted index of the value of the U.S. dollar relative to six foreign currencies. Market indexes listed are unmanaged and are not available for direct investment.
